Chinese Manufacturers Use 12 Times More Robots Than U.S. Manufacturers When Controlling for Wages
By Robert D. Atkinson | September 5, 2023
Robots are key tools for boosting productivity and international competitiveness. So, national rates of robot adoption are important indicators of economic performance. The most commonly used method for benchmarking robot-adoption rates is to calculate the number of industrial robots as a share of manufacturing workers. But it is important to consider that there is a stronger economic case for adopting robots in higher-wage economies than there is in lower-wage economies. So, the more germane question is: Where do nations stand in robot adoption when we take wage levels into account?
In 2021, China had installed 18 percent more robots per manufacturing worker than the United States. And when controlling for the fact that Chinese manufacturing wages were significantly lower than U.S. wages, China had 12 times the rate of robot use in manufacturing than the United States. The reason for this was not market forces, but government policy. The Chinese Communist Party (CCP) has made manufacturing robot adoption a top priority, backing it up with generous subsidies. To the extent U.S. policymakers talk about robots, it is usually to criticize them for taking jobs; U.S. tax policy does nothing to support robot adoption by firms; and proactive policies to help manufacturing automate, including with robots, are only minimally funded.
The International Federation of Robotics (IFR) reports data on robot use in manufacturing by various nations. The latest data is from 2021. Korea was the world’s largest adopter of industrial robots, with 1,000 robots per 10,000 manufacturing workers, while Singapore was second with 670, followed by Japan and Germany with close to 400. The United States had 274 robots per 10,000 workers, while China had 322. (See figure 1.)
Figure 1: Industrial robots per 10,000 manufacturing workers
But the decision to install and run a robot is usually based on the cost savings that can be achieved when a robot can perform a task instead of a human worker—and those cost savings are directly related to the compensation levels of manufacturing workers. It should therefore come as no surprise that high-wage Germany has a higher penetration rate of robots than low-wage India. But the interesting question is how national economies perform in robot adoption when controlling for wage levels, given that the payback time for a robot gets shorter as manufacturing labor costs increase. For a full description of ITIF’s methodology on this question, see the 2018 report “Which Nations Really Lead in Industrial Robot Adoption?”
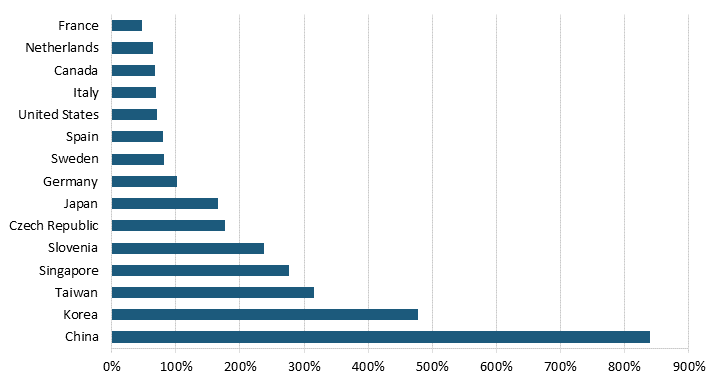
Comparing the ranking of expected robot adoption rates to actual rates, several patterns emerge. The first is that, on a wage-adjusted basis, Southeast Asian nations lead the world in robot adoption. (See figure 2.) China leads the world with an astounding 8 times more robots adopted than expected, up from 1.6 times more in 2017. Korea has 4.8 times more robots than expected. Taiwan has 3.2 times more and Singapore 2.8 times more. The United States has just 70 percent of expected robots.
Figure 2: Actual robot adoption rate as a share of expected robot adoption rate
Why Is China Ahead?
When it comes to robot adoption, China appears to be in a class of its own, with its national and provincial governments committing massive amounts of money to subsidize adoption of robots and other automation technology. This is one reason why according to IFR, China has been the world's largest market for industrial robots for eight consecutive years. Some of this may be an overstatement due to company fraud in order to get subsidies from governments for installing robots, but it is unlikely that most is.
China’s Robotics Industry Development Plan (2016–2020) set a goal of expanding robot use tenfold by 2025. As a result, many provincial governments are providing generous subsidies for firms to buy robots—although the accuracy of reported figures is perhaps dubious, as their size defies comprehension. For example, in 2018 Guangdong province planned to invest 943 billion yuan (approximately $135 billion) to help firms carry out “machine substitution.” Likewise, the provincial government of Anhui stated it will be investing 600 billion yuan (approximately $86 billion) to subsidize industrial upgrading of manufacturers in its province, including through robotics. To put this in perspective, it is the equivalent on a per-GDP basis of the United States investing $4 trillion. These numbers maybe inflated—the Boston Consulting Group reported around $6 billion in subsidies. China also provides tax incentives for equipment investment. And it has established its second five-year plan for the robotics industry. Either way, China appears to provide greater subsidies for robot adoption than any other nation, both in absolute terms and per robot. Compare that to the United States. There are no subsidies for installing robots. The federal tax code no longer even lets firms write off equipment expenditures in the first year for tax purposes.
The implications of this should be clear. The only way for the United States to compete with dollar-adjusted lower manufacturing wages in China is for manufacturers in America to be more productive—and automation, including robotics, is the key way to do that. Unfortunately, according to the U.S. Bureau of Labor Statistics, U.S. manufacturing has been in a productivity slump over the last decade. As such, unless U.S. manufacturing significantly boosts robotic adoption, China will gain even more global manufacturing market share against U.S. companies.
To reverse this, Congress should establish a 10 precent investment tax credit for manufacturers as well as triple the funding for the NIST Manufacturing Extension Service and the National Robotics Engineering Center in Pittsburgh.
