AUGUST 22, 2024
Black voters support Harris over Trump and Kennedy by a wide margin
BY KIANA COX
Black registered voters overwhelmingly support Vice President Kamala Harris over former President Donald Trump and Robert F. Kennedy Jr. in the presidential race.
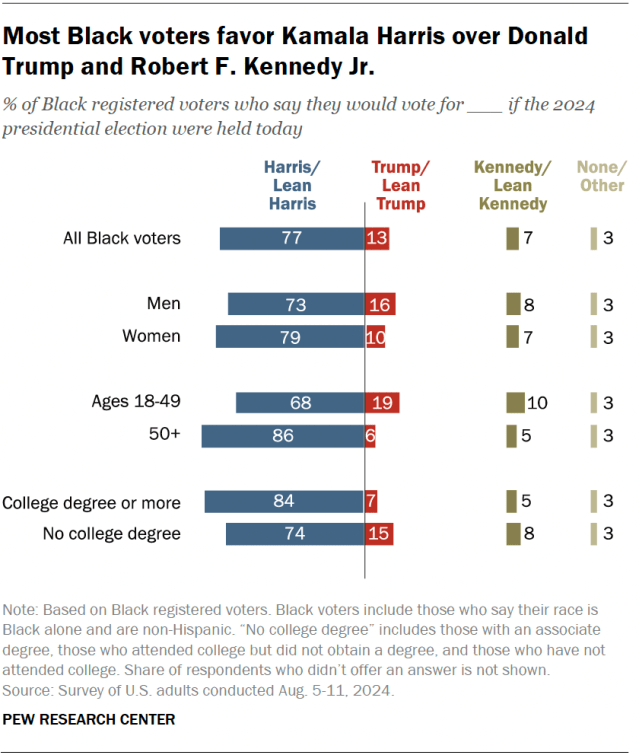
About three-quarters of Black voters (77%) say they would vote for or lean toward Harris if the 2024 presidential election were held today. Another 13% say they would back or lean toward Trump. Just 7% would support or lean toward Kennedy, according to a Pew Research Center survey of U.S. adults conducted Aug. 5-11 (before the start of the Democratic National Convention).
Black voters’ support for the top of the Democratic ticket has increased over the past month. In July, before President Joe Biden withdrew from the race and endorsed Harris, 64% of Black voters supported Biden.
Meanwhile, the share of Black voters who say they support Trump has not changed, and the share who prefer Kennedy has fallen from 21% to 7%.
How we did this
Demographic differences in Black voters’ support for Harris
Black voters differ by age in their support for Harris. While 86% of Black voters 50 and older back her, a smaller share of Black voters 18 to 49 (68%) say the same.
These age differences are consistent with those for Biden in an April 2024 survey. However, this is different from the pattern among registered voters of all races and ethnicities, where support for Harris is slightly higher among those 18 to 49 (49%) than those 50 and older (44%).
Black voters with college degrees are also more likely than those without degrees to support Harris (84% vs. 74%). This is similar to the pattern for voters overall, where Harris gets more support from college graduates (56%) than she does from those without bachelor’s degrees (41%).
In contrast, there are no significant differences by gender in Black voters’ support for Harris.
More Black voters view Harris favorably now than in the spring
About eight-in-ten Black voters (79%) have a favorable opinion of Harris, and a similar share (80%) are happy that she is now the Democratic nominee for president.
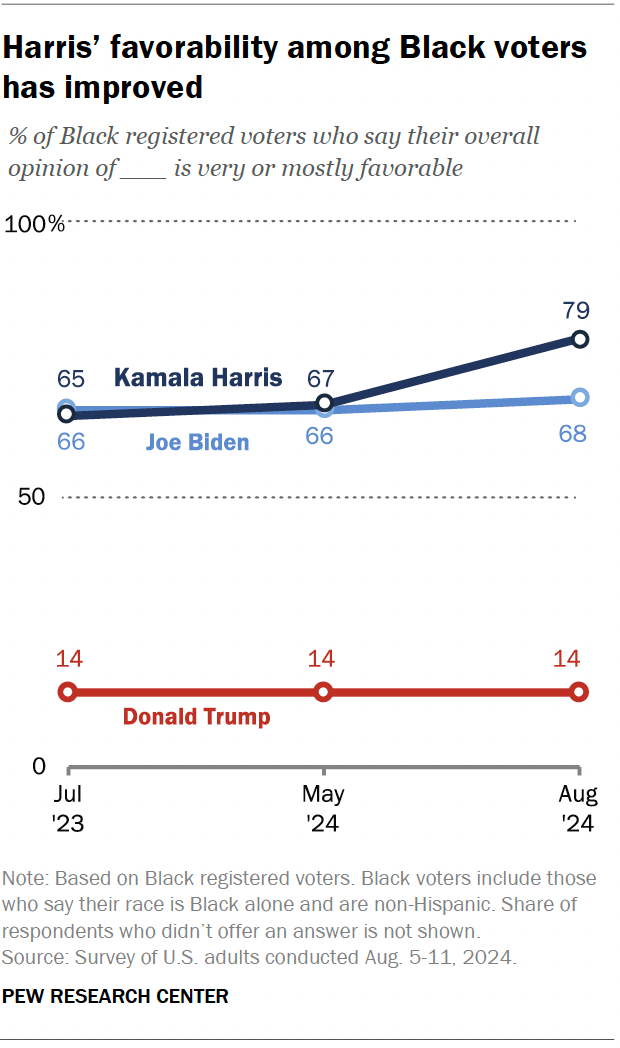
While the shares of Black voters who have a favorable view of Biden (68%) and Trump (14%) have held relatively steady since July 2023, the share who have a positive view of Harris has increased.
Roughly two-thirds of Black voters had a favorable view of Harris in July 2023 (65%) and May 2024 (67%). This share increased to 79% in August 2024, after Harris rose to the top of the Democratic ticket.
Some groups of Black voters have had particularly large shifts in opinion over the past few months:
- Women: 67% of Black women had a favorable opinion of Harris in May, compared with 82% in August.
- Younger adults: 52% of Black voters ages 18 to 49 viewed Harris favorably in May. By August, 70% did.
- Those with college degrees: Harris’ favorability ratings among Black voters with college degrees rose by 20 points from May to August (62% vs. 82%).
However, the increase in positive views of Harris is not limited to Black voters. Her favorability ratings have also increased since May among Democrats and Democratic leaners overall.
More Black voters are motivated to vote now than last month
Many voters across demographic and political groups have become more motivated to cast a ballot since July. Among Black voters specifically, the share who were extremely or very motivated to vote rose from 56% in July to 67% in August. Once again, women and those with college degrees had particularly large increases:
- 51% of Black women said they were extremely or very motivated to vote in July, compared with 67% in August.
- Motivation to vote rose by almost 20 points from July to August among Black voters with college degrees (63% vs. 81%).
Note: Here are the questions used for this analysis, the topline and the survey methodology.