After years of improvement, American public attitudes toward Muslims and Islam have declined in the past few months, and expressed public prejudice toward Muslims remains higher than toward any other religious, ethnic, or racial group studied. These are two of the key findings in our latest University of Maryland Critical Issues Poll (UMDCIP) with SSRS, which measured opinions on several relevant dimensions and compared them with previous polls. The poll was carried out by SSRS among a sample of 1,510 American adults from their probability-based online panel, in addition to oversamples of 202 Blacks and 200 Hispanics, July 26-August 1. The margin of error is +/- 3.0%.
The context
The latest poll is part of years-long research that has had two related tracks, with many of the articles analyzing the research published by Brookings over the years. One track has been measuring change in American public attitudes toward Islam and Muslims, especially since the rise of Donald Trump as a presidential candidate in 2015. The second has been to study prejudice toward racial, religious, and ethnic groups, including Jews and Muslims. As pointed out in a 2022 article, the aim has been to differentiate the intensity of prejudice (a “vertical” increase), on the one hand, and the spread of racism to more people on the other (a “horizontal” increase). Our polling on this issue has been in part designed to see if the documented occurrence of racist incidents reflects the spread of racism to more people, or if those who are already racist have seen their racism intensify.
As I noted then with my colleague Stella Rouse, there had been a worrying and documented increase in both antisemitic and Islamophobic incidents, including violent ones, over the past few years, even before the ongoing war in Israel and Gaza began on October 7, 2023. Four months after the war started, we reported in a study from a February 2024 poll that Americans say that, compared with five years before, they observed more incidents of prejudice against Jews and Muslims than against any other group in the study, including Blacks, Hispanics, and Asians.
The focus of this analysis, however, is on the degree of horizontal spread of prejudice, while recognizing the alarming vertical spread of incidents of prejudice toward both Muslims and Jews.
Key takeaways
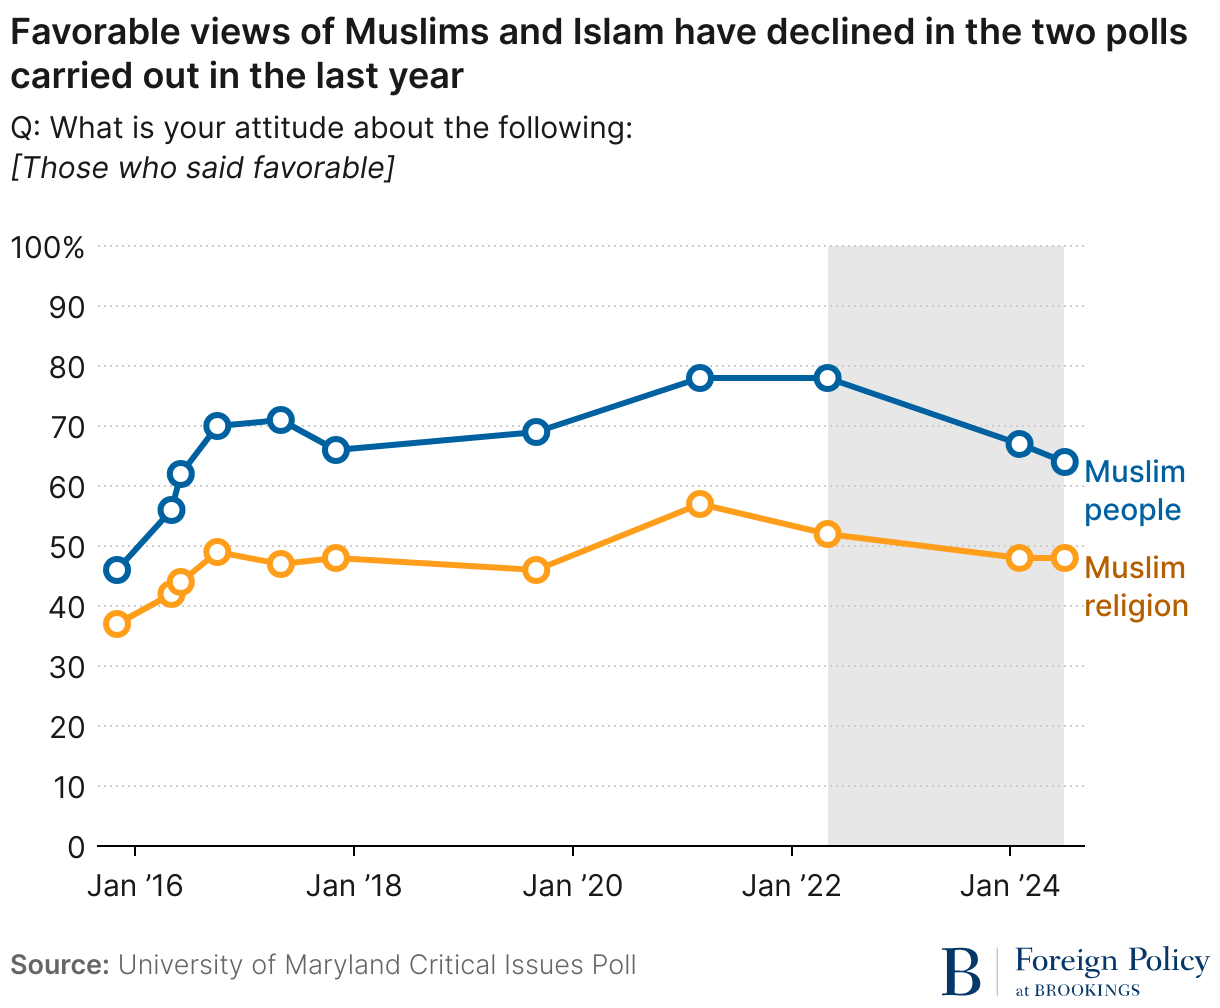
First, after years of improvement, favorable views of Muslims and Islam have declined in the two polls we have carried out in 2024. Favorable views of Muslims dropped to 64% from 78% in 2022, returning to 2016 levels; favorable attitudes toward Islam dropped to 48%.
Favorable views of Muslims and Islam have declined in the two polls carried out in the last year
Q: What is your attitude about the following:
[Those who said favorable]
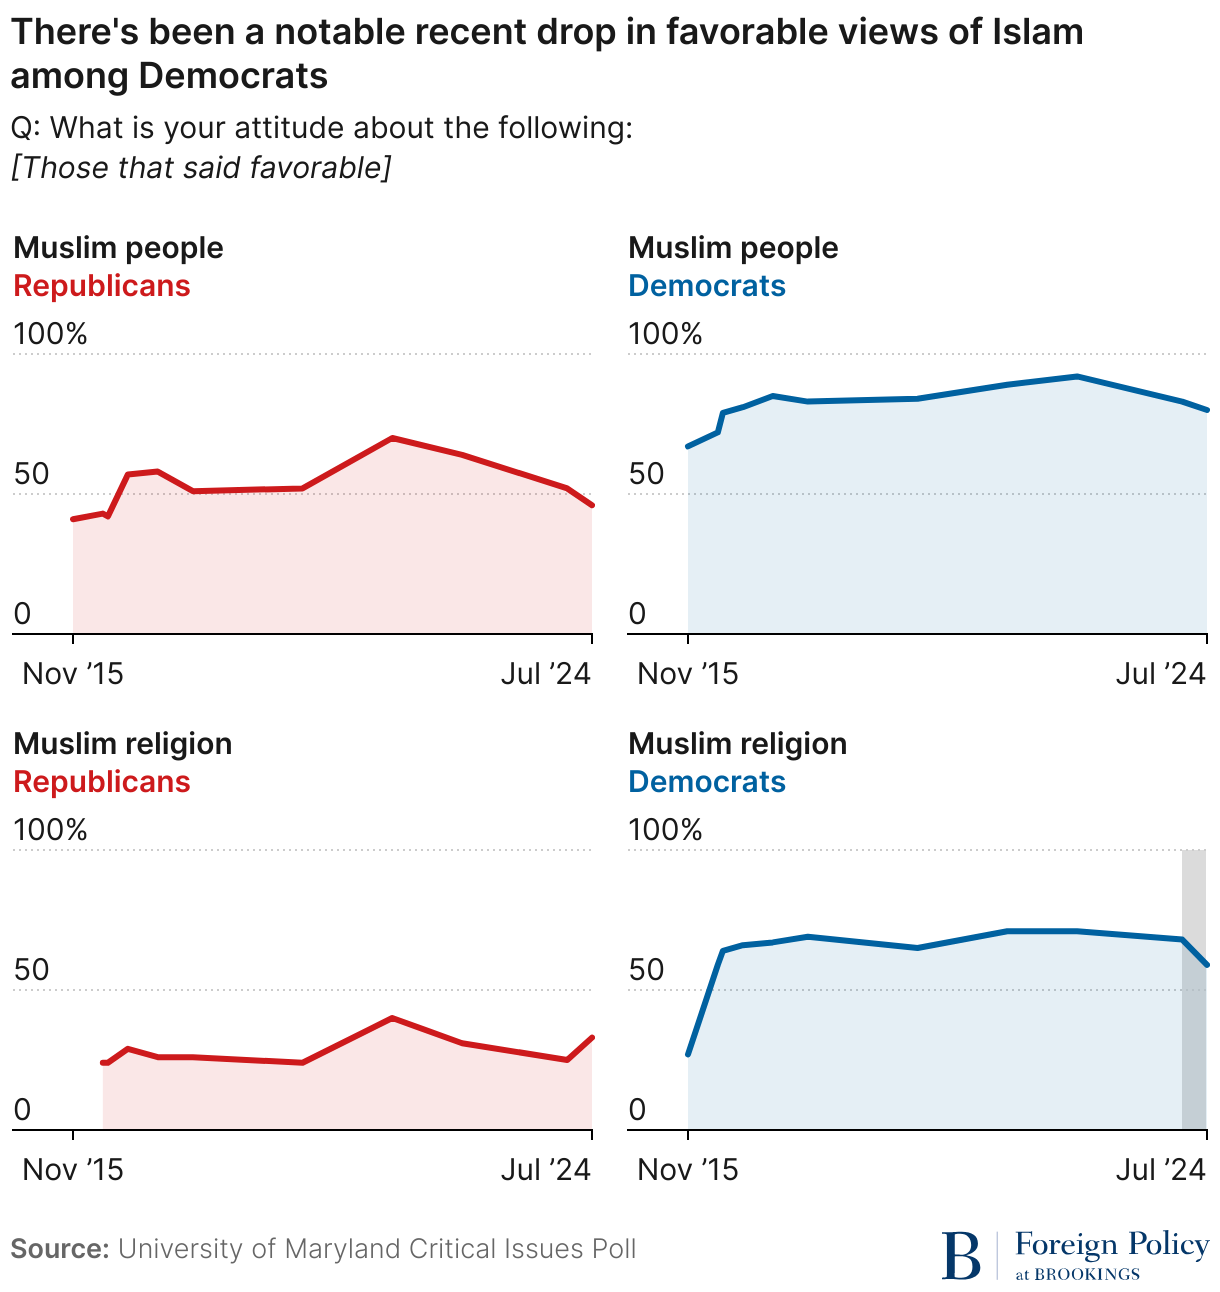
The drop in favorable views of Muslims occurred among both Democrats and Republicans, but it is notable that the drop in favorable views of Islam was more pronounced among Democrats.
There's been a notable recent drop in favorable views of Islam among Democrats
Q: What is your attitude about the following:
[Those that said favorable]
As I have been probing attitudes toward Muslims for decades, I have previously noted how American views of Muslims had remained less favorable in the years after 9/11, began improving after the 2011 Arab uprisings, and improved much more with Trump’s emergence as first a presidential candidate and then as a president. One area I have explored in the past and found strong suggestive evidence for was presidential messaging, especially when the issue is center stage, such as in crisis situations.
As I have previously argued, based on trends from multiple polls, Trump’s polarizing anti-Muslim rhetoric rallied Democrats and other anti-Trump groups behind Muslims. This was even the case after mass violence episodes were carried out on American soil in the name of Islam in 2016, after which many Americans, especially Democrats, seemed to rally behind Muslims instead of blaming them. As a result, there was a marked improvement in public attitudes toward Muslims during Trump’s presidency, even in times when the opposite could have been expected. President Joe Biden’s statements, coming at a time when there was high national attention on the war in Israel and Gaza, and especially the president’s tone, which some have criticized as insensitive to Muslim and Arab civilian casualties, raised the prospect that his stance may be dehumanizing Arabs and Muslims, as I wrote for Brookings last October. It is notable that in the two polls conducted since the start of the war, favorable views of Muslims dropped, especially among Democrats; this result is also bolstered by other measures highlighted below. But the role of Biden’s stance as a possible factor affecting public attitudes toward Muslims would require further exploration in future polls and would have to be weighed against other possible factors.
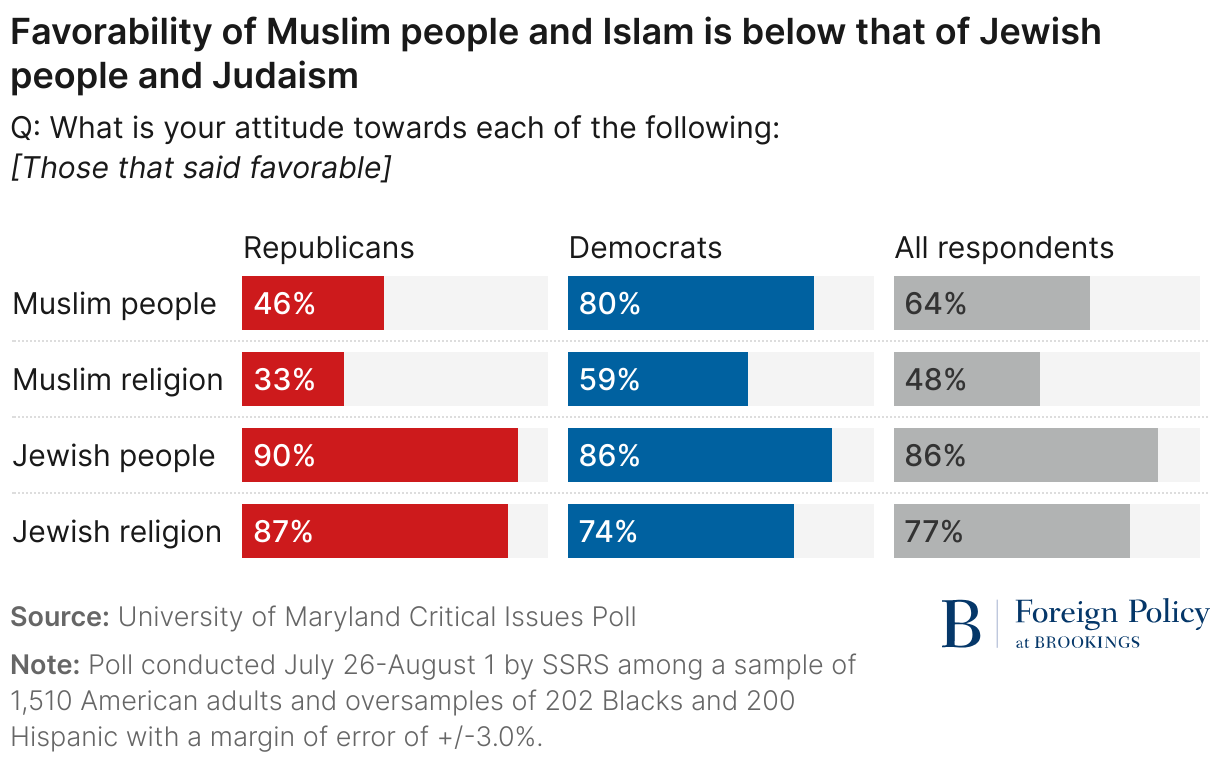
Second, prejudice toward Muslims and Islam is higher than prejudice toward Jews and Judaism. Although in past polls we asked this particular question only about Muslims and Islam, we have introduced this question in the latest poll given the rise in antisemitic incidents and the issue’s growing centrality.
Among all respondents, favorable views of Muslims were 64% compared to 86% for Jews, and favorable views of Islam were 48% compared to 77% for Judaism. The gap between attitudes toward people and religion is not uncommon and has been consistently found in our previous polling, particularly toward Muslims. Keep in mind that the fact that views of Jews are more favorable than views of Muslims does not imply that views of Jews have improved; we do not have a point of comparison on this one issue, but we plan to track it in the future. However, as noted below, there are other measures of prejudice toward Jews and others that our polls have been tracking over time.
Democrats tend to have more favorable views of Muslims than Republicans and independents, and they too tend to have more favorable views of Jews and Judaism than Muslims and Islam. Fewer than half of Republicans have a favorable view of Muslims and only one-third have a favorable view of Islam, while they overwhelmingly express favorable views of Jews and Judaism.
Favorability of Muslim people and Islam is below that of Jewish people and Judaism
Q: What is your attitude towards each of the following:
[Those that said favorable]
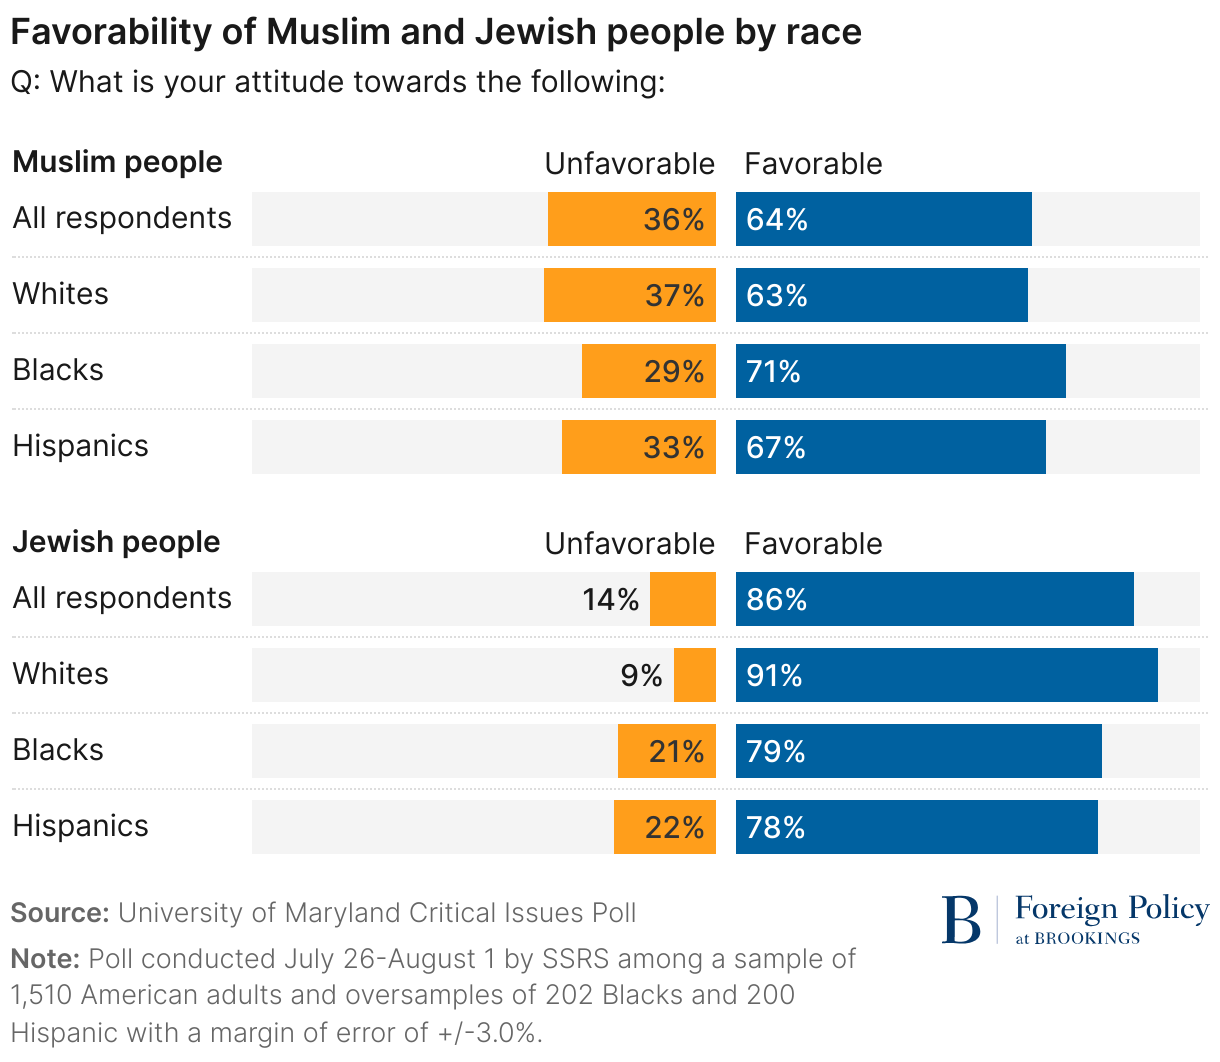
Blacks and Hispanics also hold more favorable views of Jews than Muslims; but their views of Muslims are more favorable than those of whites, and their views of Jews are less favorable than those of whites:
Favorability of Muslim and Jewish people by race
Q: What is your attitude towards the following:
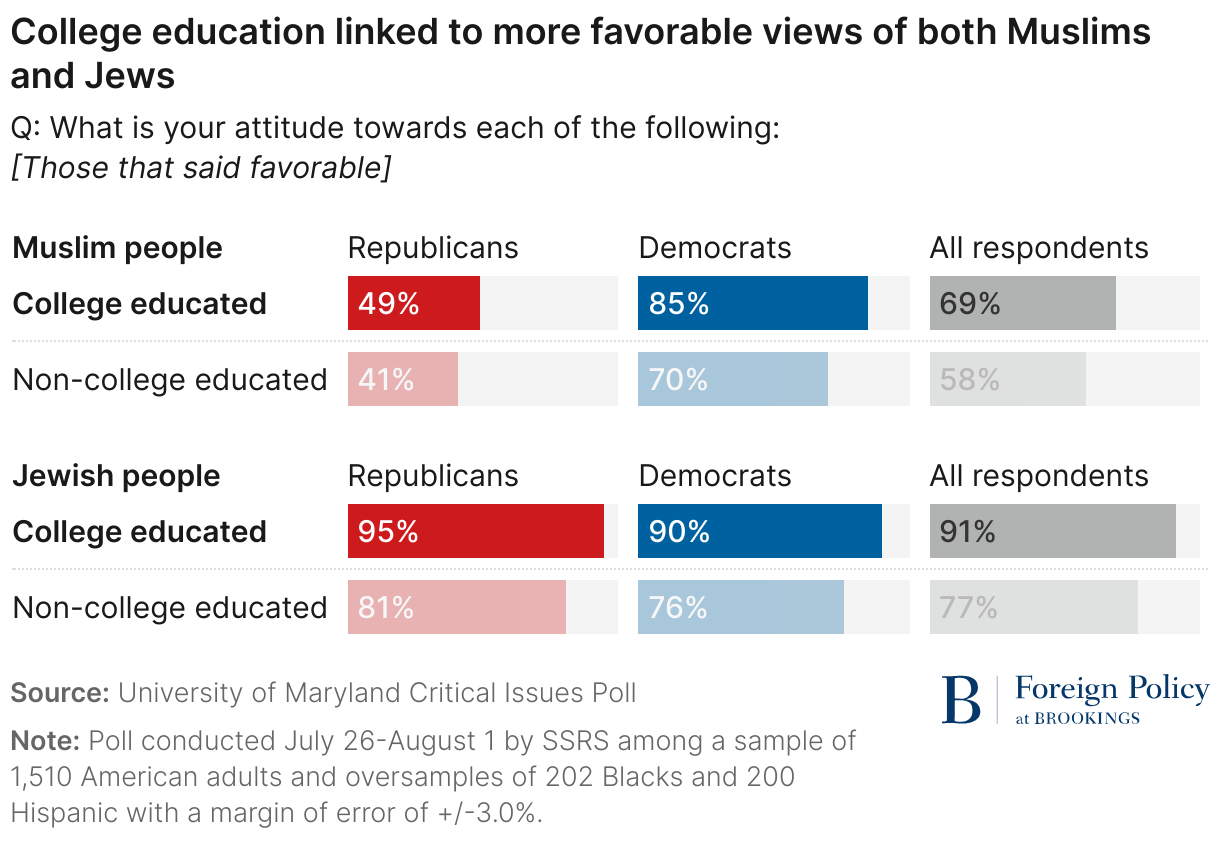
Third, those who have a college education hold more favorable views of both Jews and Muslims, compared to those without a college education. This relationship holds across all age groups, including younger Americans who are currently in college and recent graduates.
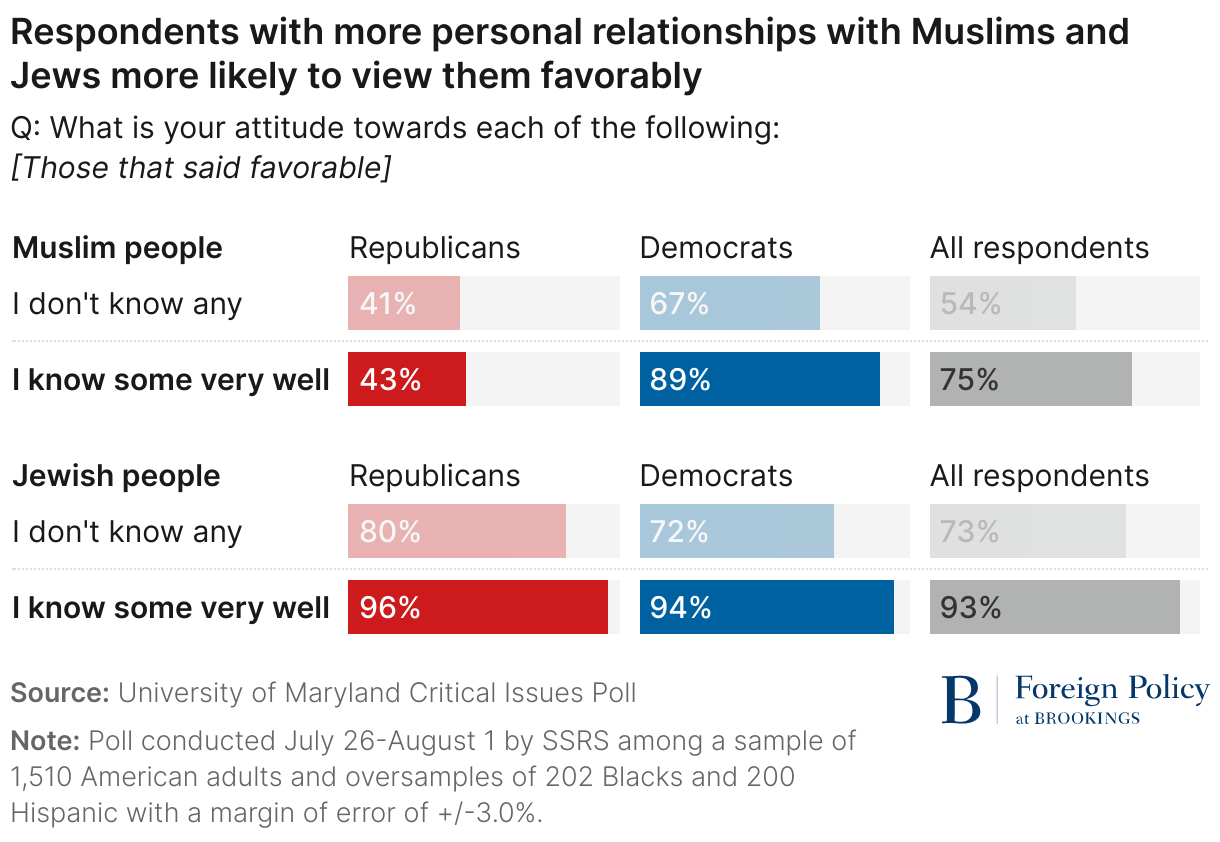
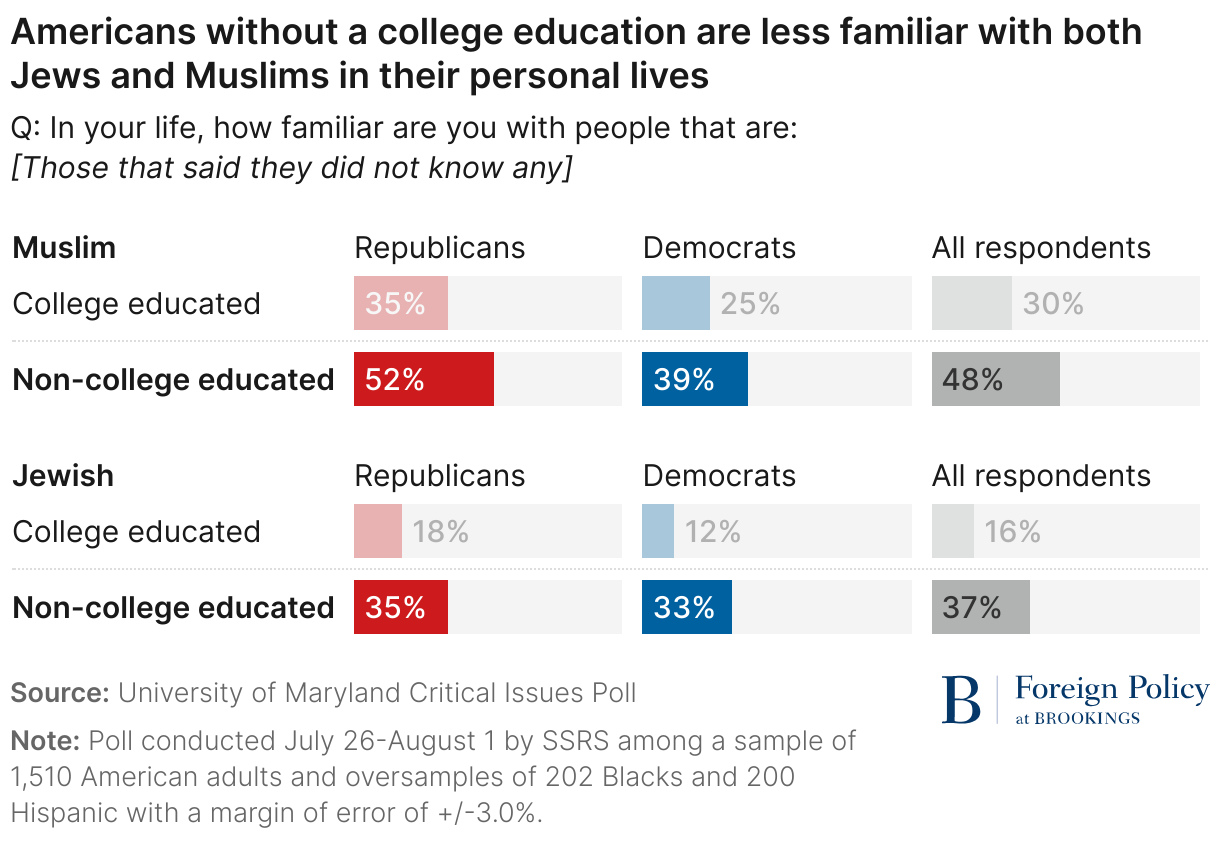
At the same time, those who are more familiar with Muslims and Jews also tend to hold more favorable views of both groups. Those who say they know some Muslims and Jews very well held more favorable views of both, while those who said they didn’t know any members of either group tended to have the least favorable views. Those with college degrees tended to also be more familiar with some Muslims and Jews than those without.
College education linked to more favorable views of both Muslims and Jews
Q: What is your attitude towards each of the following:
[Those that said favorable]
Respondents with more personal relationships with Muslims and Jews more likely to view them favorably
Q: What is your attitude towards each of the following:
[Those that said favorable]
Americans without a college education are less familiar with both Jews and Muslims in their personal lives
Q: In your life, how familiar are you with people that are:
[Those that said they did not know any]
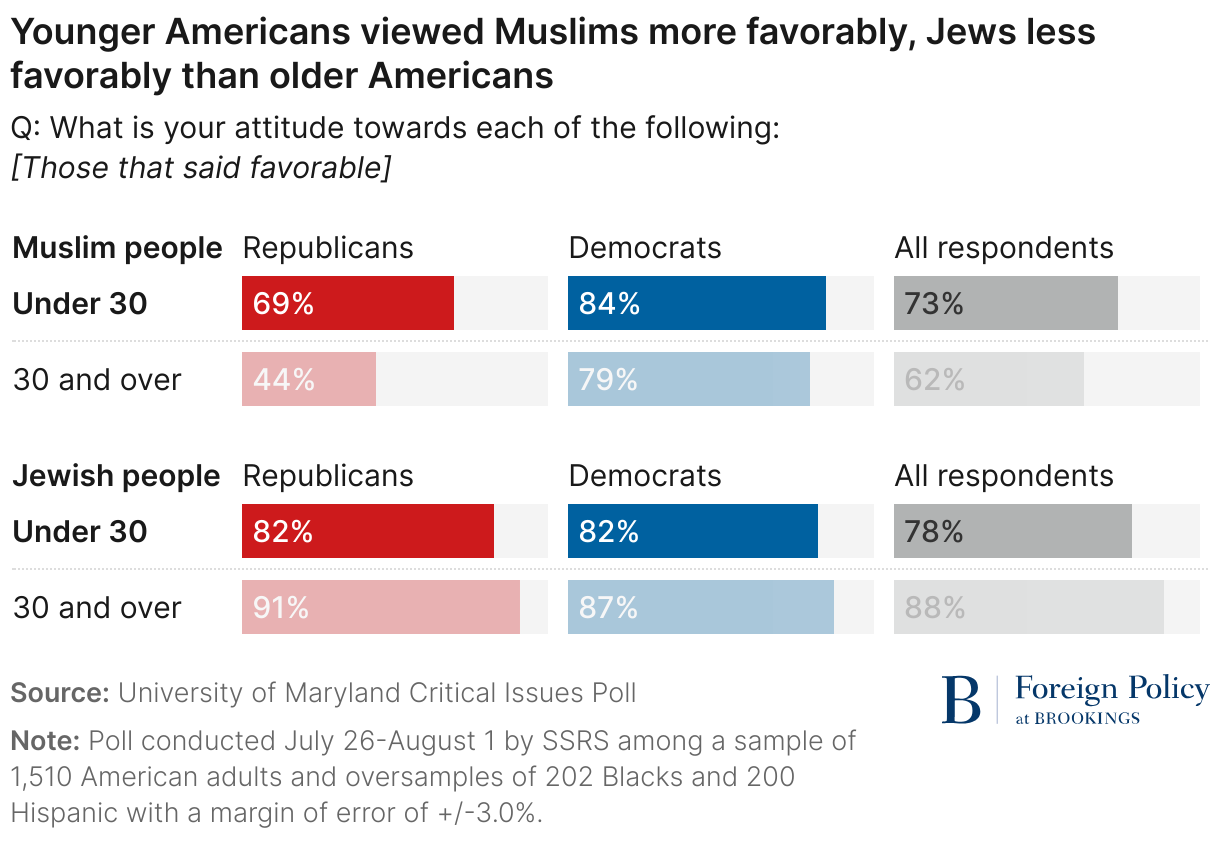
Fourth, younger Americans also hold more favorable views toward Jews than toward Muslims overall, but the trends are moving in different directions: Younger Americans (under 30), have more favorable opinions of Muslims and Islam than Americans aged 30 and over. In contrast, Americans under 30 hold less favorable opinions of Jews and Judaism than Americans aged 30 and over. The reasons for the less favorable views of Jews among young people need to be further probed, but one factor may be demographic change: Whites (90%) tend to have more favorable views of Jews than non-whites (77%) and the share of white people among younger Americans is smaller. Another possibly related factor is that young Americans say they know Jews less well than older Americans, the causes of which remain to be further probed.
Younger Americans viewed Muslims more favorably, Jews less favorably than older Americans
Q: What is your attitude towards each of the following:
[Those that said favorable]
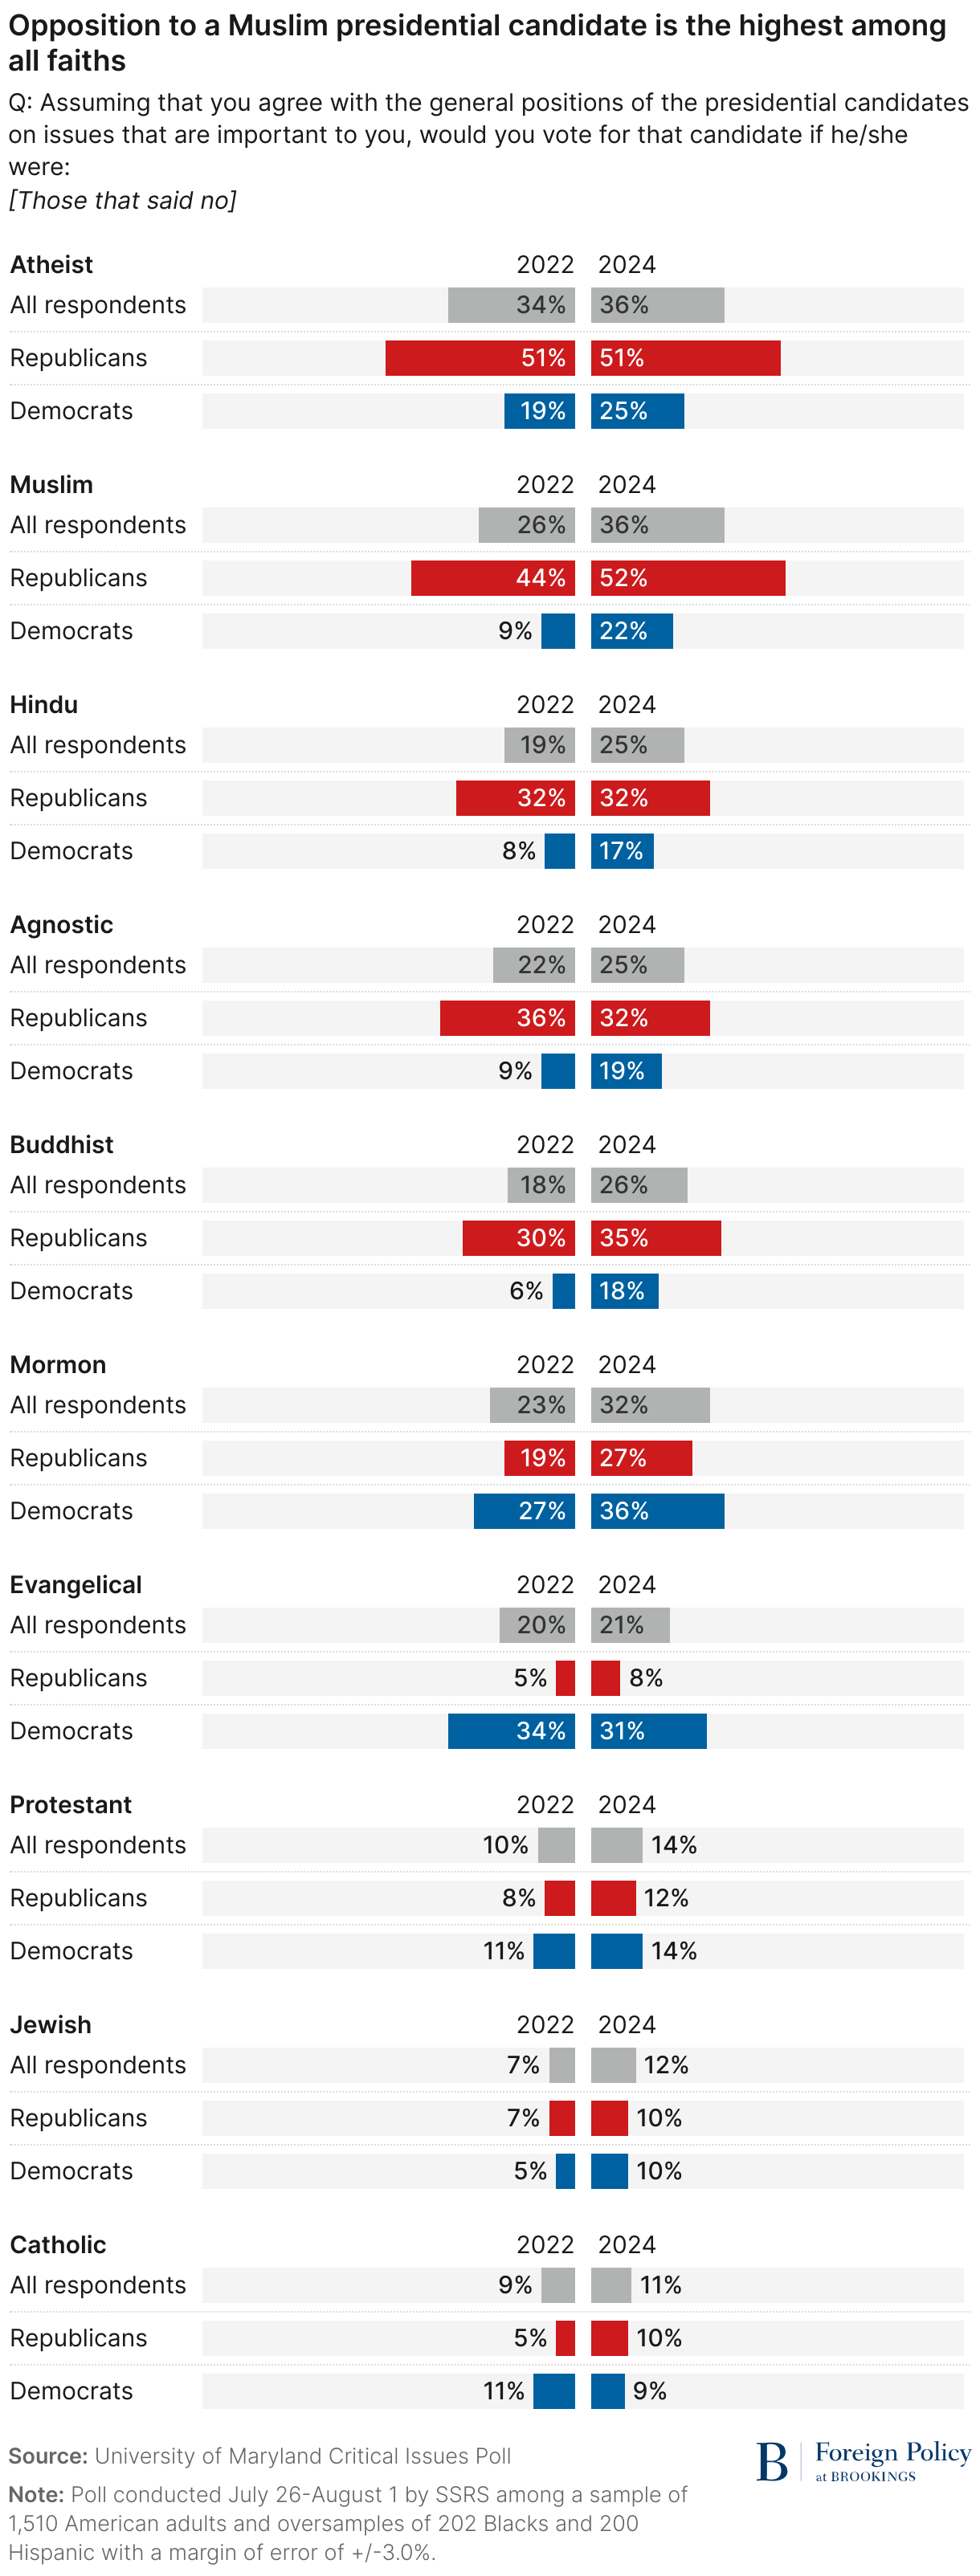
Fifth, the number of Americans opposed to Muslim presidential candidates, even if they agree with their positions on the issues, is larger than those opposing any other candidate of any other religious group. In contrast, opposition to a Jewish candidate is among the lowest, roughly on par with Protestant and Catholic candidates. Opposition to a Muslim candidate has also grown in the past year, tying for the first time opposition to atheist candidates. A majority of Republicans (52%) now oppose a Muslim candidate for president, compared to 22% of Democrats.
Opposition to a Muslim presidential candidate is the highest among all faiths
Q: Assuming that you agree with the general positions of the presidential candidates on issues that are important to you, would you vote for that candidate if he/she were:
[Those that said no]
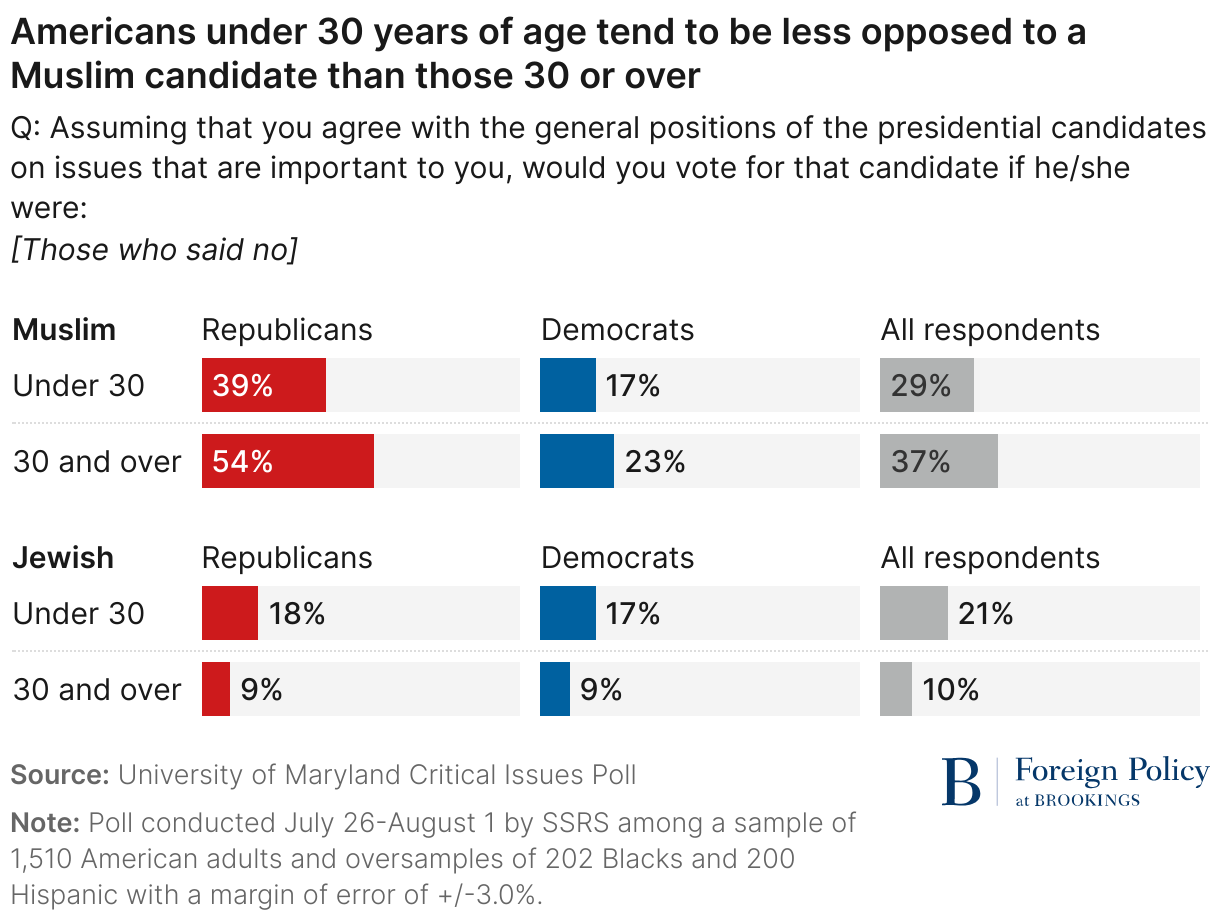
It is notable, however, that Americans under 30 years of age tend to be less opposed to a Muslim candidate than those aged 30 or older, while the opposite is true of attitudes toward a Jewish candidate.
Americans under 30 years of age tend to be less opposed to a Muslim candidate than those 30 or over
Q: Assuming that you agree with the general positions of the presidential candidates on issues that are important to you, would you vote for that candidate if he/she were:
[Those who said no]
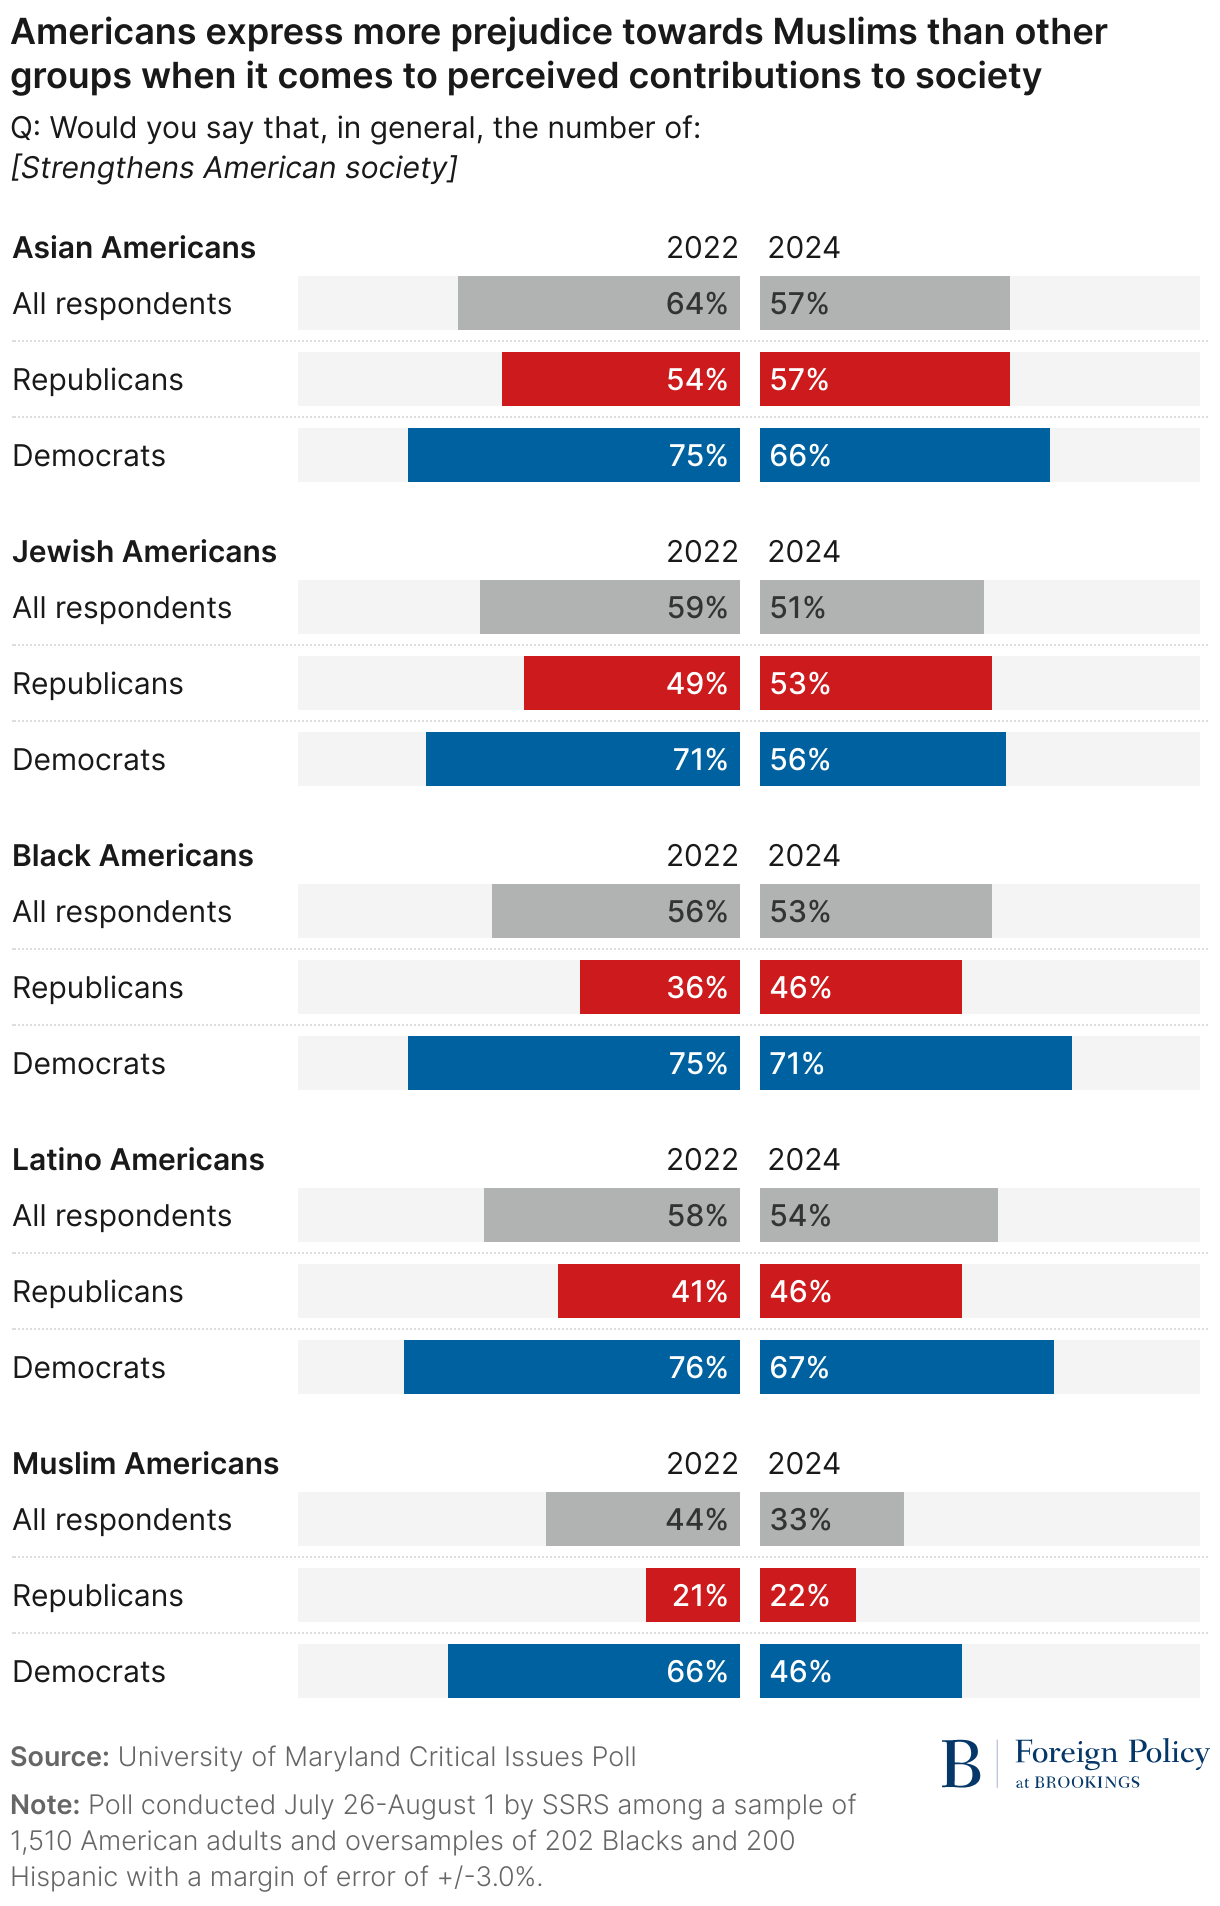
Sixth, Americans express more prejudice toward Muslims than other groups when it comes to their perceived contributions to American society.
Americans express more prejudice towards Muslims than other groups when it comes to perceived contributions to society
Q: Would you say that, in general, the number of:
[Strengthens American society]
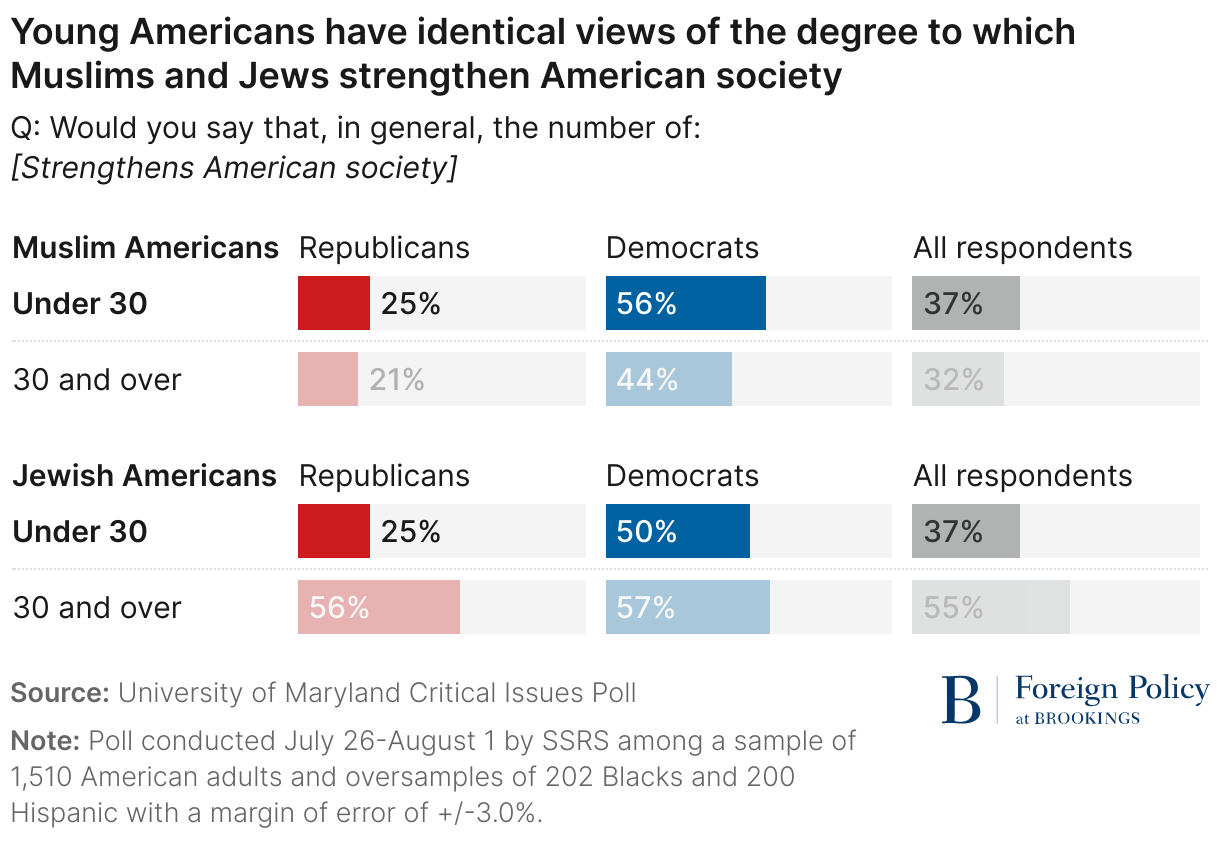
While a majority of Americans say every other ethnic, racial, and religious group we studied strengthens American society, only one-third say the same about Muslim Americans, including 22% of Republicans and 46% of Democrats. Younger Americans (under 30) tend to say Muslims strengthen American society (37%) more than those 30 years old and over (32%), with a majority of young Democrats (56%) saying that Muslims strengthen American society. It is notable that young Americans have identical views of the degree to which Muslims and Jews strengthen American society, in comparison to vast differences among older Americans who tend to see Jews as contributing far more to American society than Muslims.
Young Americans have identical views of the degree to which Muslims and Jews strengthen American society
Q: Would you say that, in general, the number of:
[Strengthens American society]
Conclusion
By some important measures, expressed American public prejudice toward Muslims remains higher than toward other groups and has increased during the past year. In fact, the ongoing war in Israel and Gaza has been accompanied by an alarming increase in incidents of hate and prejudice against both Jews and Muslims. But as I noted earlier, one driver of this research on prejudice is that the frequency of incidents of prejudice is not always correlated with the level of expressed public prejudice. Attitudes toward Muslims have worsened more than attitudes toward others, including Jews, even as incidents of prejudice have increased for both. For example, opposition to a Muslim candidate grew more than opposition to any other candidate between 2022 and 2024. And, between 2022 to 2024, the percentage of people who say Muslims strengthen American society fell by the highest amount among all groups, including Blacks, Asians, Hispanics, and Jews.
Prejudice toward Muslims is highest among all religious and ethnic groups
August 27, 2024